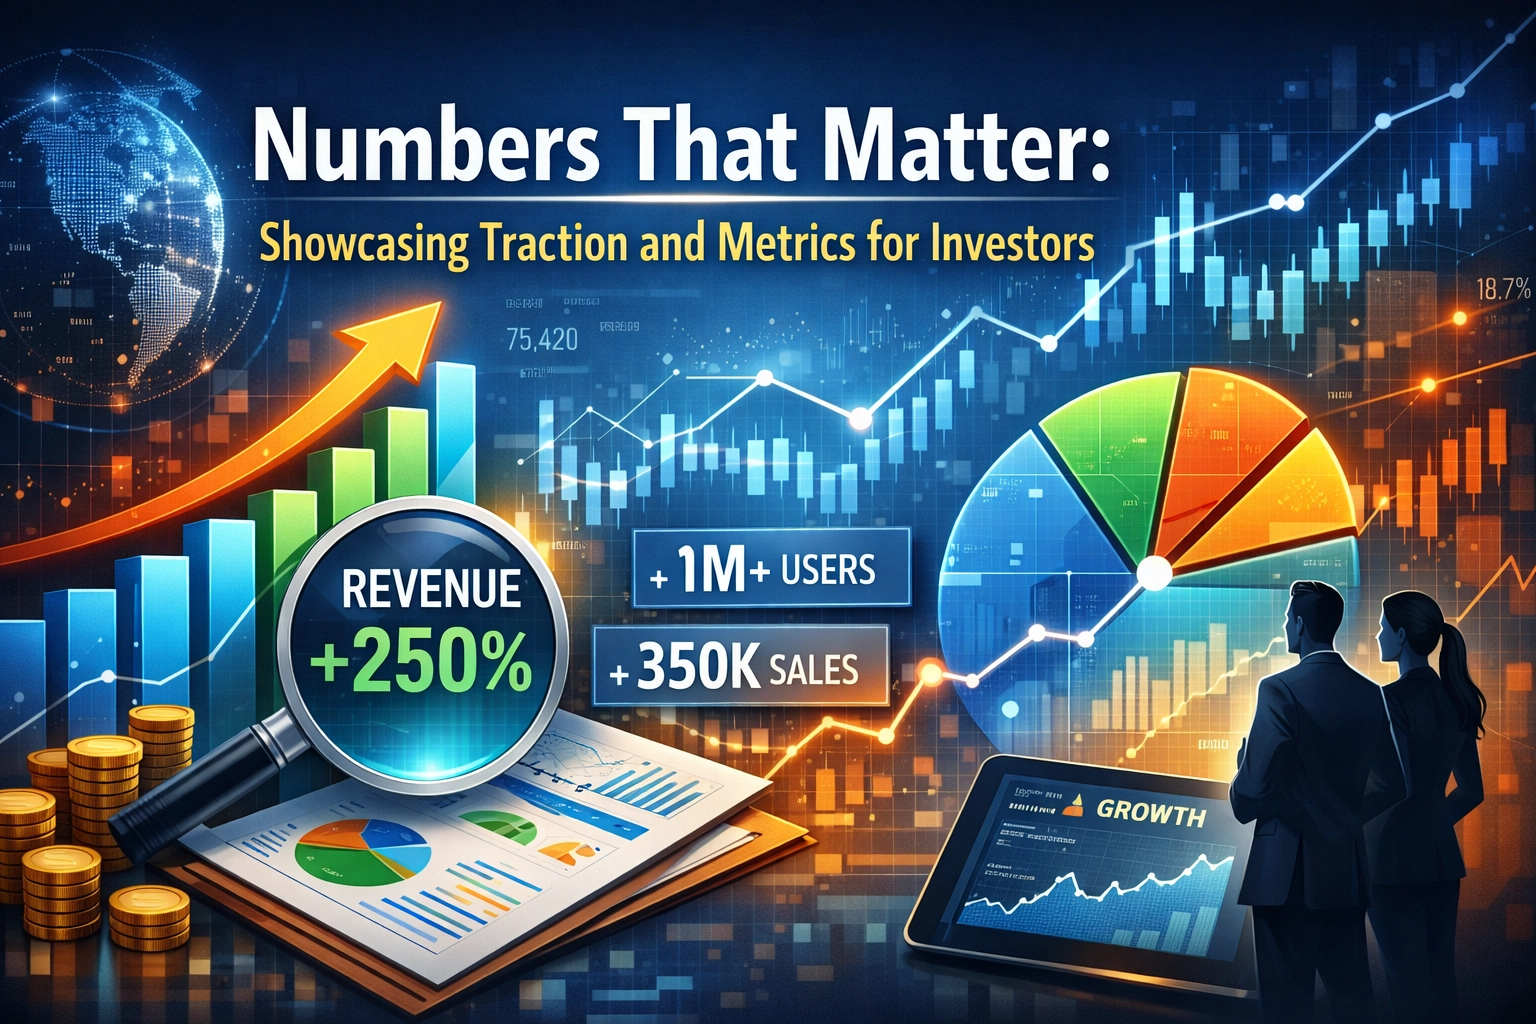
Numbers That Matter: Showcasing Traction and Metrics for Investors
In the high-stakes theater of global fundraising, your pitch deck is the script, but your Traction & Metrics folder is the evidence. Investors have heard the vision and seen the polished slides; now, they are stepping into your digital data room to see if the engine under the hood actually runs. For many founders and executives, this stage of due diligence is the most daunting. It is where "narrative" meets "arithmetic," and any lack of clarity can quickly erode trust.
At MOHBILITY, we understand that presenting data isn't just about dumping spreadsheets into a folder. It is about crafting a transparent, meticulously organized narrative of growth, efficiency, and sustainability. When you provide investors with a robust set of KPIs, you aren't just showing them the past: you are empowering them to project your future.
The Philosophy of Traction: Consistency Over Peaks
Before diving into specific spreadsheets, you must understand the "Predictability Principle." Professional investors: whether they are venture capitalists or private equity firms: value steady, repeatable growth over sporadic, inexplicable spikes. A business that grows at a consistent 8% month-over-month is often more "fundable" than one that jumps 40% one month and stays flat for the next three.
Your data room must demonstrate that you have built a system, not just an experiment. This requires a comprehensive look at your business performance analysis to ensure every number tells a cohesive story of market demand and operational excellence.

1. Revenue Metrics: The Foundation of Value
Revenue is the ultimate validator. However, "total revenue" is too blunt an instrument for sophisticated due diligence. Investors want to see the quality, recurring nature, and growth velocity of that capital.
- Monthly Recurring Revenue (MRR) & Annual Recurring Revenue (ARR): For any subscription or service-based model, these are the gold standard. They signal predictability.
- Growth Rates: Early-stage startups are often expected to show 5–7% weekly growth, while more mature, high-growth AI or tech firms should target 100%+ year-over-year.
- Revenue by Cohort: This reveals if your older customers are still spending or if your growth is entirely dependent on a constant stream of new (and perhaps expensive) acquisitions.
If your revenue model involves complex cross-border transactions or emerging markets, your documentation should also reflect how you navigate the commodity trade and investment facilitation landscape to ensure these figures are sustainable.
2. Customer Economics: The LTV/CAC Ratio
This section of your data room is where you prove that your business is a "money-making machine." If you put $1 into the machine, how much comes out the other side?
- Customer Acquisition Cost (CAC): You must be transparent about what it truly costs to win a customer. This includes marketing spend, sales salaries, and overhead.
- Lifetime Value (LTV): How much gross profit does a customer generate before they churn?
- The Magic Ratio: Investors typically look for an LTV:CAC ratio of 3:1 or higher. A ratio lower than this suggests you may be "buying" growth at an unsustainable price: a major red flag in the current 2026 investment climate which prioritizes capital efficiency.

3. Retention and Engagement: The Sustainability Factor
Acquisition is vanity; retention is sanity. A high churn rate is a "leaky bucket" that will eventually drain even the most well-funded companies. Your traction folder must include:
- Churn Rate: A healthy benchmark for SaaS is often less than 3% monthly. Anything higher requires a meticulous explanation and a clear plan for mitigation.
- Net Revenue Retention (NRR): This is perhaps the most critical metric for growth-stage investors. It measures how much your existing customer base grows (through upsells and expansions) even without new acquisitions. An NRR over 100% means your business grows just by keeping your current customers happy.
- Daily/Monthly Active Users (DAU/MAU): For tech platforms, these engagement metrics signal "stickiness." They prove that your product has become an essential part of the user’s workflow.
4. Operational Efficiency and Burn
In an era of "Strategic Capitalism," the "growth at all costs" mentality has been replaced by a focus on robust operational health. Investors will scrutinize your burn rate to calculate your "runway": how many months you can survive before needing more capital.
- Burn Multiple: This measures how much venture capital you are burning for every dollar of ARR generated. A lower multiple signals a highly efficient, disciplined management team.
- Gross Margin: High gross margins (70%+) signal a scalable software-like model, while lower margins may indicate a more labor-intensive agile implementation consulting or service-based approach.

5. Qualitative Traction: Beyond the Spreadsheet
Numbers provide the "what," but qualitative data provides the "why." To give investors total peace of mind, include evidence that validates your market position:
- Letters of Intent (LOIs) and Pilot Agreements: If you are pre-revenue or in the early stages, these documents prove that major players are willing to put skin in the game.
- Customer Case Studies: Real-world examples of how your solution solved a complex problem. You can link to your case studies to provide deeper context.
- Strategic Partnerships: Documentation of partnership identification efforts that expand your market reach or offer defensive moats against competitors.
Structuring the 'Traction & Metrics' Section for Success
A disorganized data room is a signal of a disorganized business. To ensure a seamless due diligence process, follow this hierarchy when organizing your folder:
- Executive Summary of KPIs: A one-page "cheat sheet" that highlights the most impressive figures.
- Master Traction Spreadsheet: A clean, multi-tab Excel or Google Sheet showing historical data (usually 18–24 months).
- Cohort Analysis: Detailed breakdowns of user behavior over time.
- Marketing & Sales Funnel Data: Clear visibility into lead generation and conversion rates.
- Financial Projections: A forward-looking model that is grounded in the historical traction you’ve just demonstrated.
At MOHBILITY, we specialize in startup investment facilitation, helping founders transform raw data into a compelling investment thesis. We act as your trusted partner, ensuring that your metrics are not only accurate but are presented in a way that maximizes your valuation.

Conclusion: Transform Your Data into Your Greatest Asset
The Traction & Metrics section of your data room is where you move from "asking" for investment to "justifying" it. By presenting a meticulous, transparent, and comprehensive view of your numbers, you eliminate the friction that often kills deals during due diligence.
Don't let a lack of data clarity undermine your hard work. Whether you are navigating a merger and acquisition facilitation or preparing for a Series B, the integrity of your metrics will be your strongest ally.
Ready to build a data room that commands respect?
Unlock your growth potential with MOHBILITY. Let us help you steer your business through the complexities of fundraising with expert advisory and a data-driven approach.
- Explore our Insights for more fundraising strategies.
- Review our Project Facilitation services.
- Book a consultation with Mohammed Bility and our team today.